

So far I have talked about the development, deployment, and configuration of microservices and Kubernetes in this series. Over the next couple of posts, I want to talk about an essential topic when it comes to running your services in production: logging and monitoring.
In this post, I will show you how to install the Grafana Loki stack and how you can query the logs of everything inside a Kubernetes cluster.
This post is part of “Microservice Series - From Zero to Hero”.
The Components of Grafana Loki
Grafana Loki installs various components which are used for different tasks. Let’s have a look at them:
Grafana
Grafana is a tool to query, visualize and alert metrics. These metrics can be stored in a wide variety of data sources and can be brought into Grafana via plugins. Grafana is mostly known for its beautiful graphs to display everything you want to know about your infrastructure and applications.
You can find more details on the Grafana website. In a future post, I will show you how to create your own dashboards.
Prometheus
Prometheus is an open-source project for monitoring and alerting and is also one of the oldest projects of the Cloud Native Computing Foundation (CNCF). Some of the main features of Prometheus are:
- PromQL, its own flexible query language
- a multi-dimensional data model for time series data
- collecting logs via a pull model
You can find more details on the Prometheus website. In my next post, I will show you how to use Prometheus to collect and display metrics from your microservices and Kubernetes cluster.
Promtail
Promtail is an agent for Loki. It discovers services, for example, applications inside a Kubernetes cluster or nodes of the cluster, and sends the logs to Loki. You can find more details in the Promtail documentation.
Loki
Loki is a highly available logging solution. It gets described by its developers as “Like Prometheus but for Logs”. It indexes the labels of the logs and allows querying of these logs using LogQL. You can find more details in the Promtail documentation.
Installing Grafana Loki using Helm
You can find the code of the demo on GitHub.
The Grafana Loki stack can be easily installed with Helm charts. If you are new to Helm, check out my previous posts Helm - Getting Started and Deploy to Kubernetes using Helm Charts for more details.
Use the following code to add the Grafana Helm chart, update it and then install Loki:
Installing Grafana Loki using an Infrastructure as Code Pipeline
In one of my past posts, I have created an Infrastructure as Code (IaC) Pipeline using Azure CLI. If you want to automatically deploy Loki, add the following code after the Kubernetes deployment in your pipeline:
The above code adds two variables, for the version of Loki and the namespace where it gets deployed and then does basically the same as the Helm deployment in the section above.
Get the Credentials for Grafana
After installing Grafana Loki, you have to read the admin password from the secrets. You can do this in PowerShell with the following code:
Use the following code when you are on Linux:
These commands get the secret for the admin password, decode it from base 64, and then print it to the console.
Access Grafana
Before you can access Grafana, you have to create a port forwarding to access the Grafana service. You can do this with the following code:
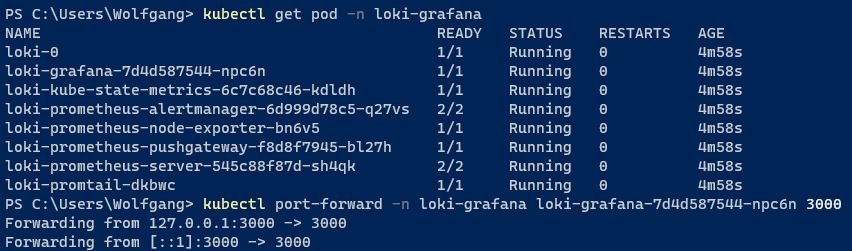
Configure the port forwarding to access Grafana
This configuration enables you to access the Grafana dashboard using http://localhost:3000. Enter the URL into your browser and you will see the Grafana login screen.
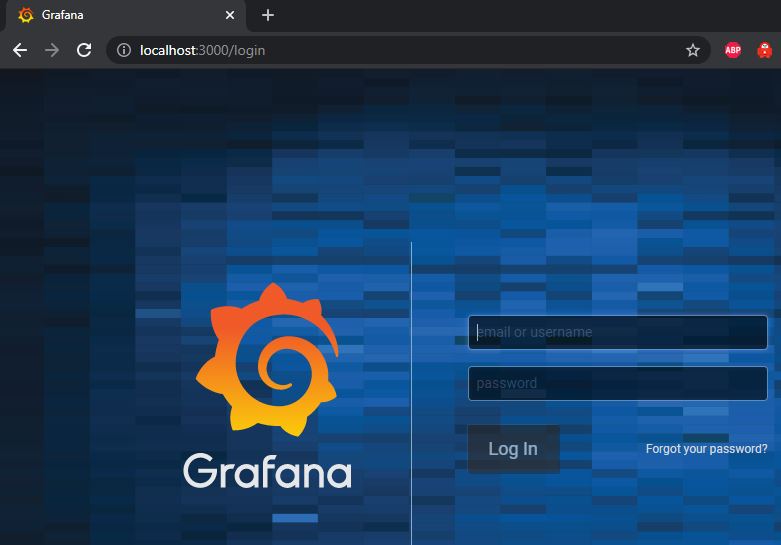
The Grafana login screen
The user name is admin and the password is what you decoded in the previous step.
Create your first Query in Loki
After the successful login, click on the round icon on the left and select Explore to open the query editor.
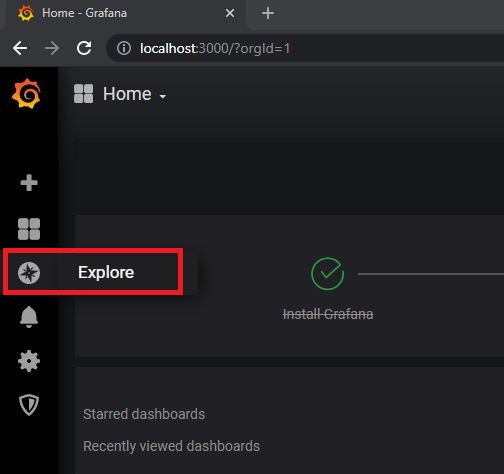
Open the Loki query editor
On the top of the page, select Loki as your data source and then you can create a simple query by clicking on Log labels. For example, select pod and then select the loki-grafana pod to query all logs from this specific pod. The query looks as follows:
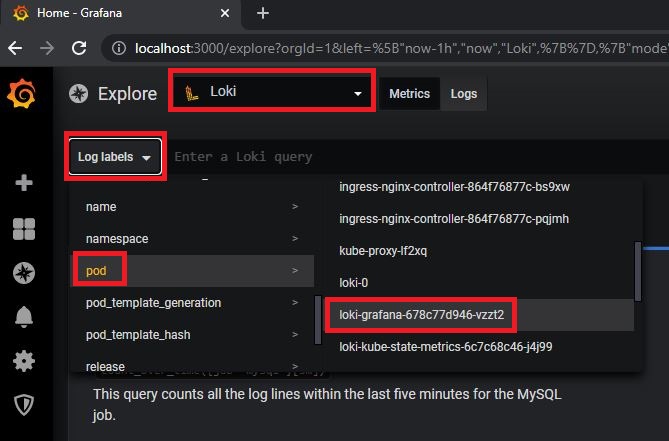
Create your first Loki query
The query will display all logs from the grafana-loki pod. For more details about a log entry, click on it. You can see a successful login on the following screenshot.
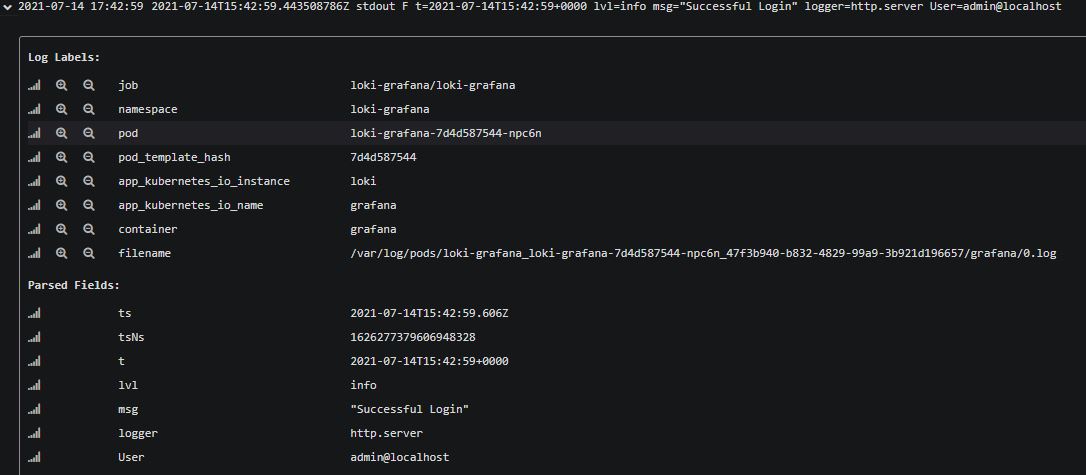
A successful login got logged
Filter your Logs
Displaying all the logs is nice but not really useful. Usually, you want to filter your logs and only display problematic entries like errors. You can use the following query to display only log entries with the error level:
This query is more useful than displaying all logs but often you also want to search for a specific log message. You can do this easily by extending the query:
This query displays all error logs with an Invalid Username or Password in the log message.

Query only error logs
LogQL Query Language
All the queries above use LogQL. The examples above are just scratching the surface of what you can do with LogQL but it should be enough to get you started. For more details about LogQL, check out the documentation.
Conclusion
Analyzing logs is essential for every project running in a production environment. Grafana Loki offers a lot of functionality out of the box like automatically collecting logs from each object in Kubernetes and sending it to Loki where you can query and filter these logs. The examples in this post are very simple but should be enough to get you started.
In my next post, I will show you how to use Prometheus, which was also installed by Loki, to scrape metrics from the microservices.
You can find the code of the demo on GitHub.
This post is part of “Microservice Series - From Zero to Hero”.
Comments powered by Disqus.