

Kubernetes is a great tool to run and manage our applications. An important aspect of using a tool like Kubernetes is how easy it is to find and fix problems. Tracing and debugging a microservice architecture can be quite hard and is perhaps the biggest downside of it.
Microsoft allows developers to route traffic from a Kubernetes cluster to their local environment to debug microservices without the need to deploy a full cluster on your developer machine.
This post is part of “Microservice Series - From Zero to Hero”.
What is Bridge to Kubernetes
Bridge to Kubernetes, formerly known as Azure Dev Spaces, is a tool that allows to test and debug microservices on a developer’s machine while using dependencies and configurations of an existing Kubernetes cluster. This is especially useful when you have a bug in a production environment which you can not replicate in your development environment. This bug might only occur in high-load scenarios. For more information, see the Bridge to Kubernetes GA announcement.
Configure Bridge to Kubernetes
You can find the code of the demo on GitHub.
In this demo, I will change one of my microservices and debug it with requests from my AKS cluster. If you don’t have a cluster running yet, see “Microservice Series - From Zero to Hero” for all the tutorials to create a microservice, AKS cluster, and how to deploy it.
Install the Visual Studio Code Extensions
Open the microservice you want to debug in Visual Studio Code and open the Extensions tab. Search for Kubernetes and install the Kubernetes and Bridge to Kubernetes extensions.

Install the Bridge to Kubernetes Extension
Configure the Kubernetes Namespace for Debugging
After installing the Extensions, press CRTL + Shift + P, type in Bridge, and select Bridge to Kubernetes: Open Menu.
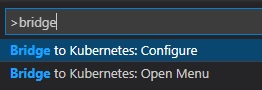
Open the Kubernetes Menu
This opens the Kubernetes menu where you can see your clusters. Open the Namespace tab of the cluster you want to debug and make sure the right namespace is selected. The selected namespace has an asterisk (*) at the beginning. If the wrong namespace is selected, right-click the namespace you want to use and select “Use Namespace”
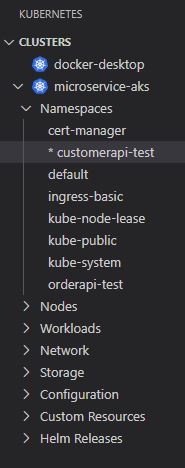
Configure the Namespace
Configure Bridge to Kubernetes
After setting the namespace, press CRTL + Shift + P again and type Kubernetes: Debug. From the drop-down, select Kubernetes: Debug (Local Tunnel).
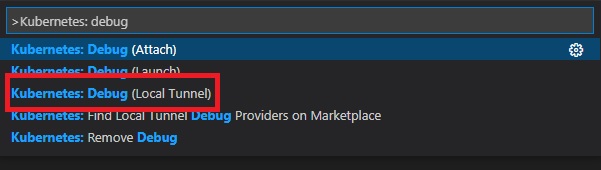
Start configuring the Bridge to Kubernetes
This opens the configuration assist for the connection into the Kubernetes cluster. First, select the service you want to debug. Since my namespace only has one service, I only see the customerapi service in the drop-down.
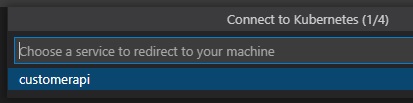
Select the service to debug
Next, enter the port on which your microservice is running on your local machine. You can either start your application and check the port, or you can open the launchSettings.json file in the Properties folder and check there.
The port is 5001 in my case.

Configure the port of your local microservice
In the next step, select a launch config for your microservice. If you use my demo, you can find this config under CustomerApi/CustomerApi/.vscode.
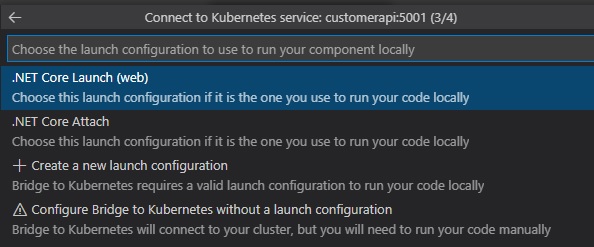
Select a launch config
In the last step, configure if you want to redirect all requests to your machine or only specific ones. In a production environment, you would want to only redirect your requests but for this demo, select No to redirect all requests to your machine.
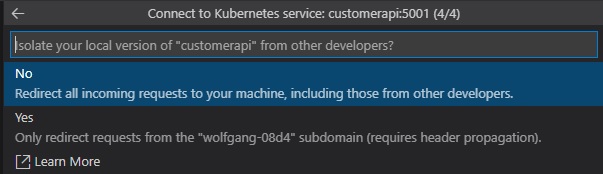
Configure what requests get redirected
Start debugging your Microservice
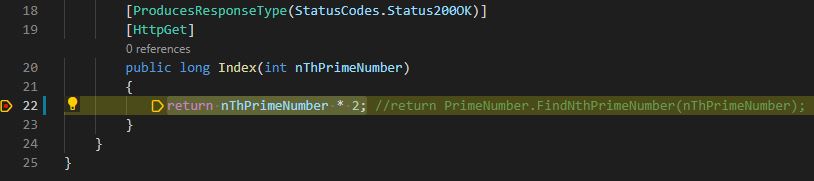
Let’s imagine that there is a new feature for the microservice and from now on the PrimeNumber controller should not calculate a prime number anymore but rather return the double of the entered number (I know it is a stupid example but that’s fine for this demo). Change the code of the Index action in the PrimeNumber controller to return the entered number * 2 and set a break-point to debug the code later.
Now you are ready to start the microservice. Press CRTL + Shift + D or select the debug tab and then start the application with the launch setting with the Kubernetes configuration.
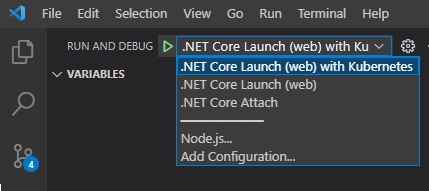
Start with the Kubernetes settings
If Visual Studio Code can establish a connection to the Kubernetes cluster, the bar on the bottom will turn orange.
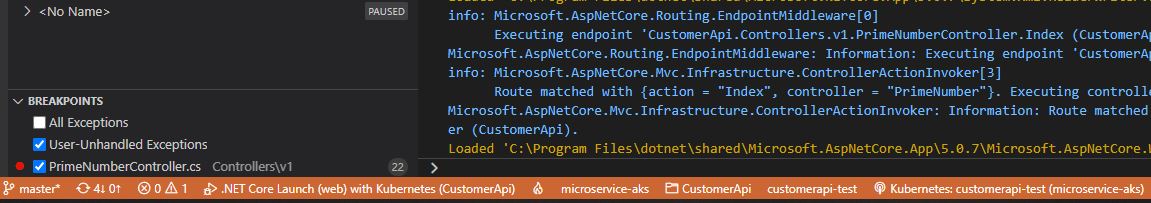
The bar turns orange when connected to K8s
Debug Requests from your Kubernetes Cluster
After starting the microservice, open the public URL of the application running in your Kubernetes cluster. In my case that’s test.customer.programmingwithwolfgang.com. This request displays the Swagger UI. There, open the PrimeNumber method, enter a number and execute the request.
The request was redirect to your local machine
You can see that the breakpoint in the application running locally on your machine was hit with that request. When you continue the execution, you will also see that the return value is what you expected from your new feature (the user entered 11, 11 * 2 = 22).
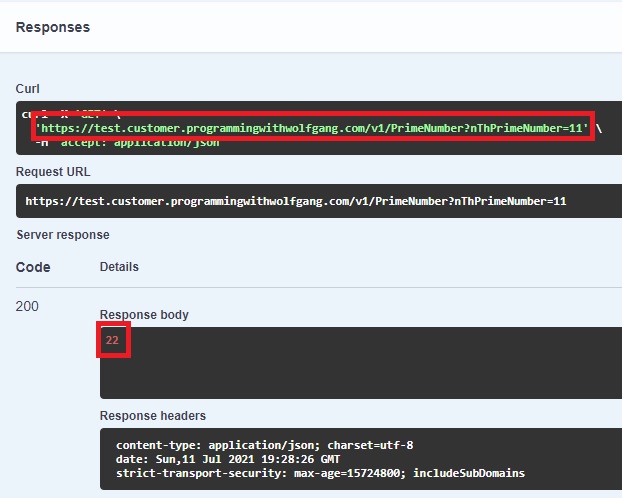
The request was processed in your microservice running locally
When you stop the application on your machine and execute the request again, you will see that the return value changed to 31 (which is the 11th prime number).

The request without debugging
Conclusion
Modern applications become more and more complex and therefore get harder to debug. Bridge to Kubernetes allows developers to redirect requests inside a running Kubernetes cluster onto their own machine to debug microservices. This allows debugging code without the need to set up a whole environment and also allows using the dependencies and configuration of the running K8s cluster.
You can find the code of the demo on GitHub.
This post is part of “Microservice Series - From Zero to Hero”.
Comments powered by Disqus.