
Knowledge is power is a famous saying which also holds true when running software. You would like to know how many errors occur, how long the response times of your services are, and also how many people are even using your application.
In my last post, I added Grafana Loki to log events but it also installed Prometheus which I will use in this post to log messages from my microservices in my Kubernetes cluster.
This post is part of “Microservice Series - From Zero to Hero”.
What is Prometheus?
Prometheus is an open-source monitoring and alerting system and was the second project to join the CNCF (Cloud Native Computing Foundation) in 2016. It has more than 6000 forks and almost 40K stars on GitHub with a very active community. Prometheus collects data using a pull model over HTTP and does not rely on distributed storage solutions. This allows you to create several independent Prometheus servers to make it highly available.
The components of Prometheus are the server itself, client libraries, an alert manager, and several other supporting tools.
The client libraries allow you to publish log messages which can be scraped by Prometheus. Further down, I will show you how to do that in .NET 5. The Alertmanager can send alerts to a wide range of systems like email, webhooks, Slack, or WeChat.
Prometheus can be used as a data source in Grafana where you can easily create beautiful dashboards. I will show you this in my next post.
Available Metric Types
Prometheus knows the following four metric types:
- Counter: A counter whose value can only increase or bet set at zero.
- Gauge: A number that can go up or down.
- Histogram: Samples of observations that are counted in buckets.
- Summary: Like the histogram but can calculate quantiles.
Installing the Prometheus Client Library in .NET 5
You can find the code of the demo on GitHub.
Installing the C# Prometheus client libraries is very simple. All you have to do is to install the prometheus-net and prometheus-net.AspNetCore NuGet packages
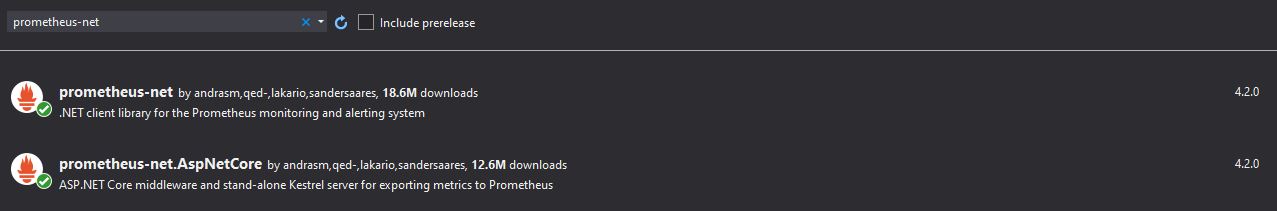
Install the Prometheus NuGet Packages
Next, add the metric server to expose the metrics which can be scraped by Prometheus. Use the following code and make sure you add it before app.UseEndpoints… in the Startup.cs class:
Start your application, navigate to the /metrics endpoints and you will see the default metrics which are exposed from the client library.
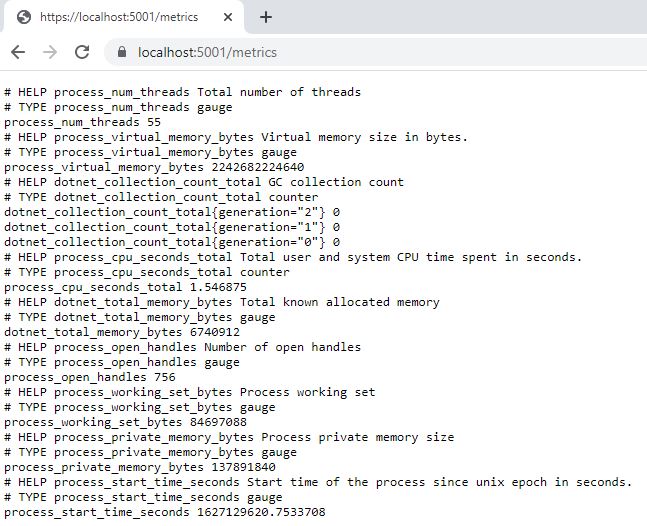
Prometheus default metrics
The metrics might look confusing at first but they will be way more readable once you created your first dashboard.
Add Prometheus Metrics
The Prometheus client libraries allow you to easily create your own metrics. First, you have to collect the metrics. You can use the following code to create a counter and histogram:
The code above will expose the response time for each HTTP code, for example, how long was the response for an HTTP 200 code. Additionally, it counts the total number of requests. To use the code above, create a new middleware that uses the MetricCollector.
The last step is to register the new middleware in the Startup.cs class. Add the following code to the ConfigureServices method:
After registering the collector, add the middleware to the Configure method:
When you start your microservice and navigate to /metrics, you will see the number of different requests and the response time.
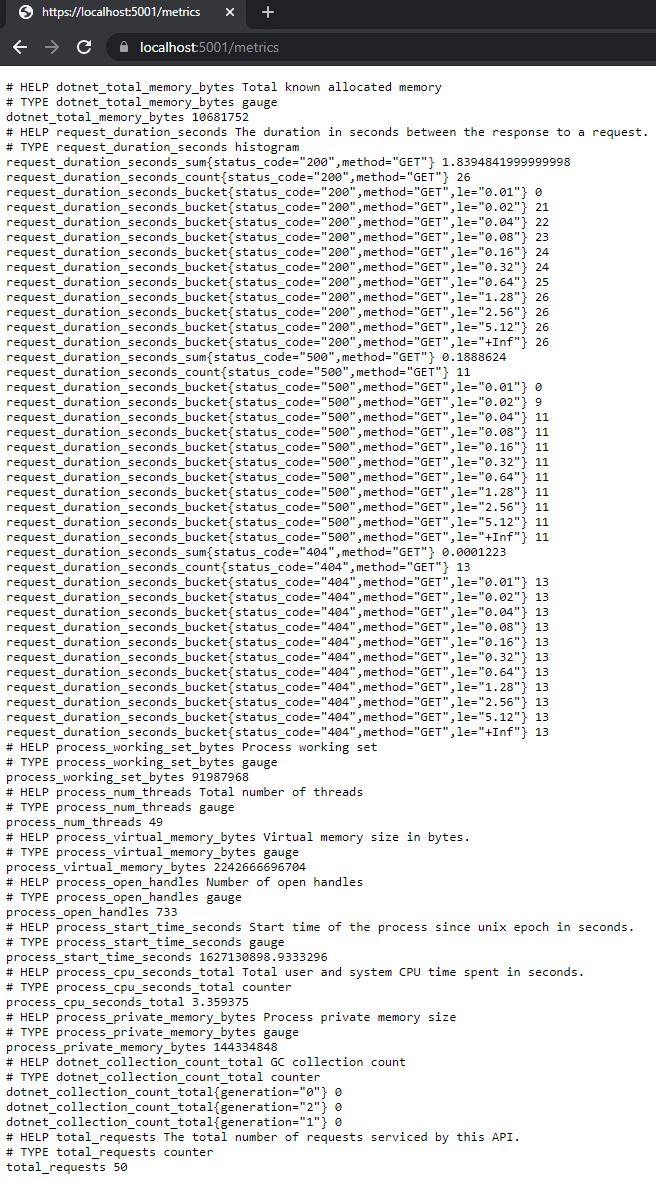
Test the custom metrics
The code for the MetricCollector and the middleware were taken from GitHub.
Conclusion
Prometheus is the go-to solution for collecting metrics in dockerized environments like Kubernetes. This demo showed how to add the Prometheus client library to a .NET 5 microservice and how to create your own metrics.
In my next post, I will show you how to use these metrics to create dashboards with Grafana.
You can find the code of the demo on GitHub.
This post is part of “Microservice Series - From Zero to Hero”.
Comments powered by Disqus.